What Your Task Velocity Is Really Telling You
A Task Velocity score is easy to read at a glance — the tier label does that part for you. But the label alone misses most of what the number is actually telling you. This is for people who already know what Task Velocity is and want to use it as a diagnostic, not just a badge.
The Three Reasons Velocity Drops
When Task Velocity falls below 1.0x or trends downward over several weeks, it's almost always one of three things.
Inbox inflation. You're capturing more than you're processing. This is common right after a busy period starts, or when you've been using Principal Task as a capture-only tool without doing regular reviews. The signal here is a large number of open tasks with no due dates, no folders, and no statuses. Filtering the velocity chart by folder and finding one folder with dramatically lower velocity than the others usually points straight at the culprit. The fix is a deliberate audit: assign, break down, or delete the tasks that are inflating the list.
Genuine workload increase. Sometimes you're just being asked to do more than can be done. This shows up as a consistent downward trend even when your tasks are well-organized and your completion rate on individual items is healthy. If this is what's happening, the score is telling you something real about capacity, not about your system. The useful question isn't "how do I fix my score" — it's "what do I stop doing, defer, or delegate?"
Leftover tasks from finished work. Tasks that were relevant three months ago but will never be completed are still counted. They sit as persistent open items and drag the denominator of your score upward without any corresponding completions. Oldest-open-task lists that stretch back months or years usually mean a cleanup pass — completing, canceling, or deleting them — will give a more accurate picture and likely raise the score.
When a Score Below 1.0x Is Fine
A score below 1.0x during certain periods isn't a warning sign — it's a natural reflection of how work happens. When something big starts, a lot of tasks get created at once and completion lags behind creation for a few weeks. In a research or planning stretch, inventory builds before execution does. When life gets unusually busy, completions slow down even when the effort doesn't.
The pattern that warrants attention isn't a single low reading — it's a sustained downward trend over several consecutive 30-day windows, or a score that's been below 1.0x long enough to erode confidence in the task list as a reliable view of the real work. A brief dip followed by recovery is normal variation. A floor that keeps dropping is a signal.
Using Filters to Diagnose Your Score
Premium feature. The filter controls, and the historical chart itself, are on the Dashboard's Task Velocity panel and require a paid plan. Free users see a description and an upgrade prompt there — not a score. The current score is always visible elsewhere: the Home screen's Velocity tile on mobile, the header card on web. See Task Velocity: Your Productivity Pulse for where those live.
The most powerful use of Task Velocity isn't the overall number — it's the filtered number. Premium unlocks filtering the velocity chart by Folder, Context, Priority, and Status from the gear icon on the velocity card. Each filter changes the score to reflect only the tasks that match.
The diagnostic value is in the comparison. An overall velocity of 1.1x that drops to 0.5x once filtered to the largest folder has found where the backlog is accumulating. A specific context producing a dramatically different score than another context is an imbalance in how different types of work are moving. The overall score smooths over these differences; the filtered score surfaces them.
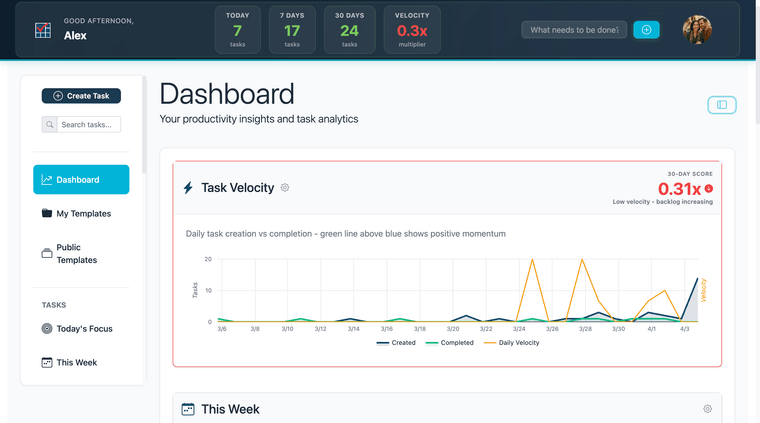

On mobile, the same filters sit behind the settings icon on the velocity card.
The Weekly Velocity Review
The most useful habit around Task Velocity isn't watching the number daily — it's checking it as part of a weekly review. Once a week, the score and the trend are worth two questions: is it moving in the direction the week suggests, and is anything unusual worth investigating?
The goal isn't to maximize the number. A sustained 1.5x might mean trivial tasks are getting cleared while important ones get deferred. A 0.9x during a hard week might be exactly right. What matters is a pattern that's understood, not a number that's optimized. When the score surprises — higher or lower than expected — that's the useful signal. Something in the work changed, and velocity is the instrument that caught it.
For the broader weekly review practice that makes this habit effective, see Building a System That Actually Works.
What to Do When Velocity Stalls
A score that's been flat or declining for several weeks calls for deliberate action. A few moves tend to break the stall.
Audit tasks open longer than 30 days. Tasks that survive a review but never get done are false positives — they inflate the denominator without ever contributing a completion. Anything that's sat that long deserves a clear decision: complete it now, break it into a real next action, or let it go.
Break large tasks down. A single task called "Update the proposal," open for two weeks, contributes nothing to velocity until it's complete. Broken into the real steps — pull last year's version, update section two, send it out for review — completions start registering right away. See Break Any Project Down with Subtasks for how to structure this.
Use due dates to surface work. Tasks without due dates don't appear in Today's Focus or This Week. Large undated blocks of the list stay invisible until someone goes looking. Dates make work visible, which makes it more likely to get done.
Clear completions the same day. The velocity calculation depends on completion timestamps. Tasks finished but not marked complete don't register. Marking tasks done the moment they're finished, rather than batching it at the end of the week, keeps the score accurate and responsive.
Use the velocity filters to find the stall point. Premium chart filters, narrowed by folder and context, tend to show exactly where completions are lagging. A stall is rarely distributed evenly — it usually has a source.